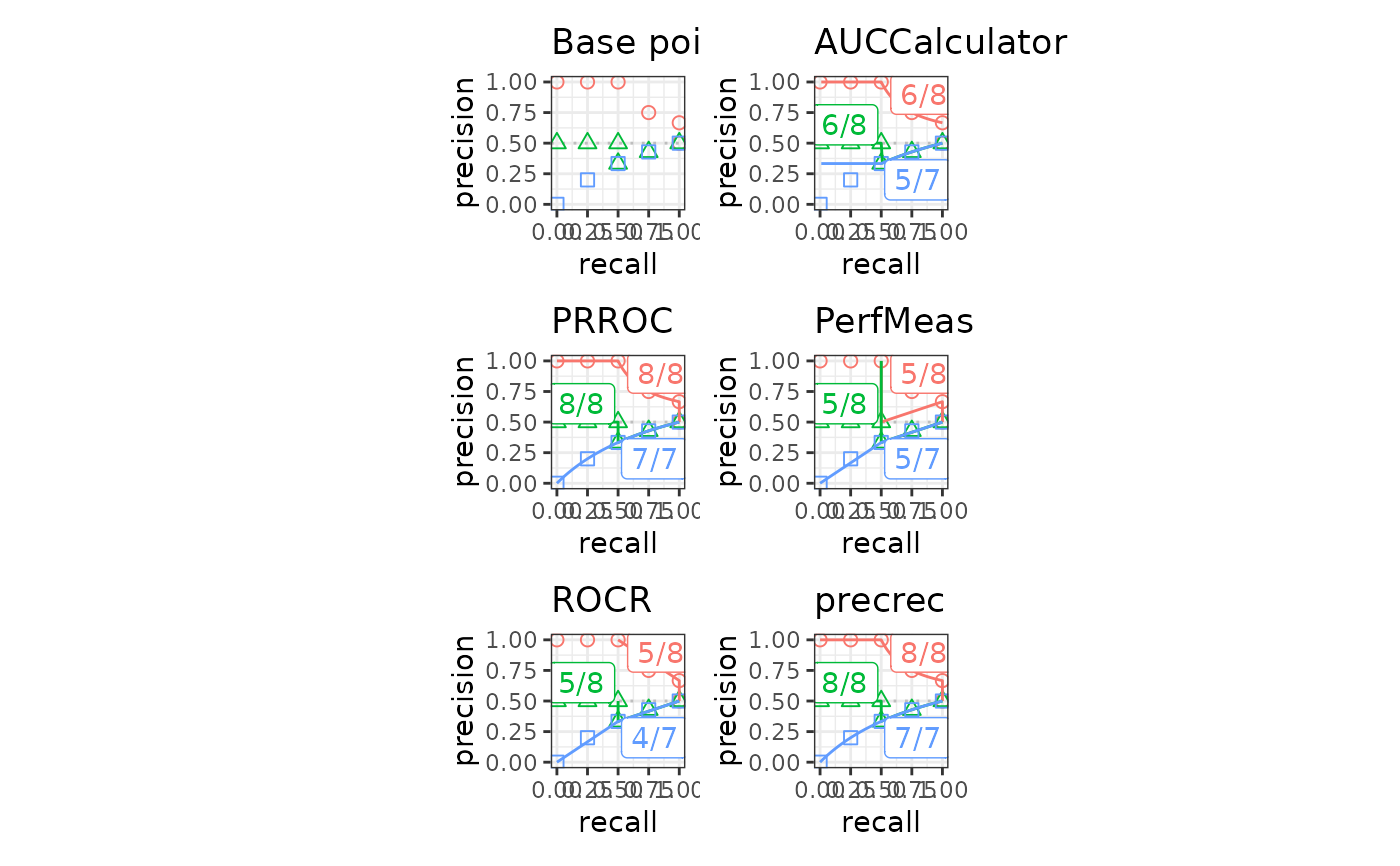
The plot_eval_results function validates Precision-Recall curves
and creates a plot.
# S3 method for class 'evalcurve'
autoplot(
  object,
  base_plot = TRUE,
  ret_grob = FALSE,
  ncol = NULL,
  nrow = NULL,
  use_category = FALSE,
  multiplot_lib = "patchwork",
  ...
)
Arguments
- object
An S3 object that contains evaluation results of Precision-Recall curves.
- base_plot
A Boolean value to specify whether the base points are plotted.
- ret_grob
A Boolean value to specify whether the function returns a grob object.
- ncol
An integer used for the column size of multiple panes.
- nrow
An integer used for the row size of multiple panes.
- use_category
A Boolean value to specify whether the categorical summary instead of the total summary.
- multiplot_lib
A string to decide which library is used to combine multiple plots. Either "patchwork" or "grid".
- ...
Not used by this function.
Value
A data frame with validation results.
Examples
library(ggplot2)

## Plot evaluation results on test datasets r1, r2, and r3
testset <- create_testset("curve", c("c1", "c2", "c3"))
toolset <- create_toolset(set_names = "crv5")
eres1 <- run_evalcurve(testset, toolset)
autoplot(eres1)
#> Warning: Removed 3 rows containing missing values or values outside the scale range
#> (`geom_line()`).