


precrec calculates and plots ROC and precision-recall curves for binary classifiers. It is built for the case where the two curves disagree: on an imbalanced dataset a ROC curve can look excellent while the precision-recall curve shows the classifier is not usable. All the main calculations are implemented in C++ through Rcpp.
Quick example
library(precrec)

# Load a test dataset
data(P10N10)

# Calculate ROC and Precision-Recall curves
sscurves <- evalmod(scores = P10N10$scores, labels = P10N10$labels)
# The ggplot2 package is required
library(ggplot2)

# Show ROC and Precision-Recall plots
autoplot(sscurves)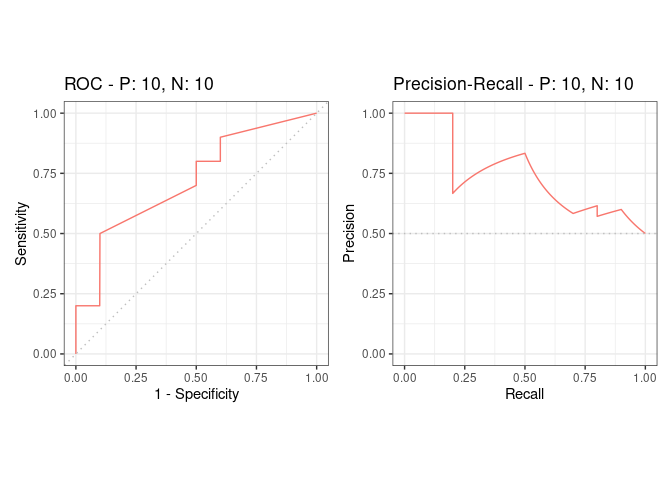
auc(sscurves) gives the areas, and as.data.frame(sscurves) gives the curve points.
Documentation
Everything is on the package website, in short pages:
-
Get started – the five-minute tour. Also available offline with
vignette("introduction", package = "precrec"). - How-to – one page per task: preparing data, several test sets, cross-validation, more than two classes, large datasets.
- Compare and decide – which model to ship, at which threshold, and how sure you can be.
- Metrics – what each available metric means and when it misleads.
- Plots – every plot the package draws, and how to change it.
-
Reference – the help page of every function, each with examples. Also
help(package = "precrec").
Why precrec
Accurate curves. Non-linear interpolation, elongation to the y axis where the first point is undefined, and score-wise thresholds instead of fixed bins. Joining raw precision-recall points with straight lines – what most tools do – overestimates the area.
Fast. Curves over a large dataset take seconds. mode = "aucroc" computes the ROC area from the U statistic without building the curve at all.
Many metrics. Fourteen per-cutoff metrics by default and seventeen more on request, plus AUC, partial AUC, the precision-recall break-even point, and the probability-based Brier score, RMSE and log loss. See the metrics overview.
Several models and several test sets. Averaged curves with confidence bands, cross-validation folds, and confidence intervals of the AUC.
More than two classes. One-vs-rest decomposition, with per-class and macro-averaged areas.
Partial curves. Partial AUCs for any x or y range, standardized so ranges of different widths can be compared.
Installation
Install the release version from CRAN:
install.packages("precrec")Or the development version from GitHub, which needs a working compiler (Rtools on Windows, Xcode on macOS, the usual build tools on Linux):
# install.packages("devtools")
devtools::install_github("evalclass/precrec")
Functions
| Function | Description |
|---|---|
evalmod |
Main function to calculate evaluation metrics |
mmdata |
Reformat input data for performance evaluation calculation |
join_scores |
Join scores of multiple models into a list |
join_labels |
Join observed labels of multiple test datasets into a list |
create_sim_samples |
Create random samples for simulations |
format_nfold |
Create n-fold cross validation dataset from data frame |
prob_metrics |
Calculate the Brier score, the RMSE and the log loss |
prob_metrics_ci |
Calculate CIs of the Brier score, the RMSE and the log loss |
metric_curve |
Draw one evaluation metric against another |
metric_table |
Get every evaluation metric at every cutoff |
best_cutoff |
Pick the cutoff that optimizes one evaluation metric |
prbe |
Find the precision-recall break-even point |
average_precision |
Calculate the step estimator of the PRC area |
classification_report |
Report precision, recall and F-score per class at a threshold |
auc_boot |
Bootstrap the AUC of a single test set |
auc_delong |
Analytic standard error of the ROC AUC (DeLong) |
auc_diff |
Compare the AUCs of two models on the same resamples |
Ten S3 generics work on the objects evalmod and metric_curve return.
| S3 generic | Package | Description |
|---|---|---|
print |
base | Print the calculation results and the summary of the test data |
as.data.frame |
base | Convert a precrec object to a data frame |
as.data.table |
data.table | Convert a precrec object to a data.table |
plot |
graphics | Plot performance evaluation metrics |
autoplot |
ggplot2 | Plot performance evaluation metrics with ggplot2 |
fortify |
ggplot2 | Prepare a data frame for ggplot2 |
auc |
precrec | Make a data frame with AUC scores |
part |
precrec | Calculate partial curves and partial AUC scores |
pauc |
precrec | Make a data frame with pAUC scores |
auc_ci |
precrec | Calculate confidence intervals of AUC scores |
Citation
Precrec: fast and accurate precision-recall and ROC curve calculations in R
Takaya Saito; Marc Rehmsmeier
Bioinformatics 2017; 33 (1): 145-147.
External links
Classifier evaluation with imbalanced datasets - our web site that contains several pages with useful tips for performance evaluation on binary classifiers.
The Precision-Recall Plot Is More Informative than the ROC Plot When Evaluating Binary Classifiers on Imbalanced Datasets - our paper that summarized potential pitfalls of ROC plots with imbalanced datasets and advantages of using precision-recall plots instead.